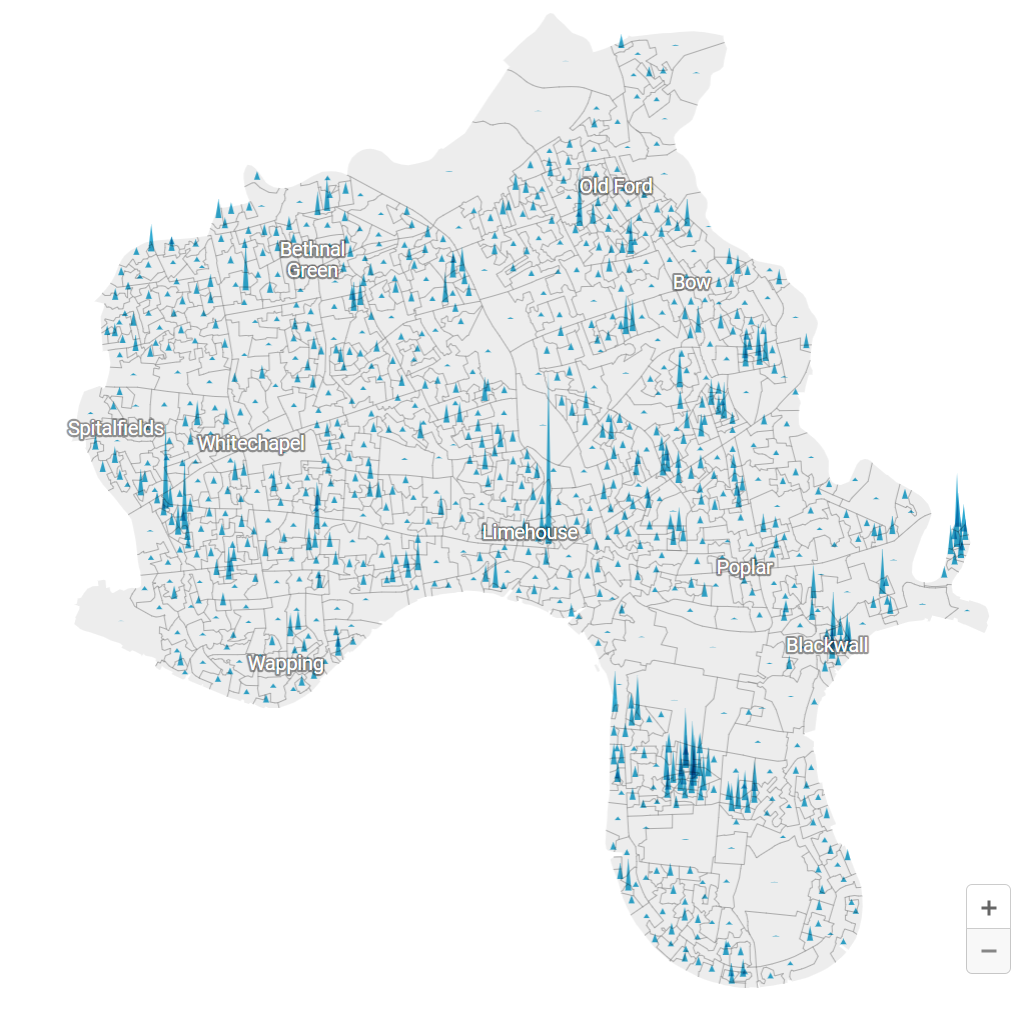
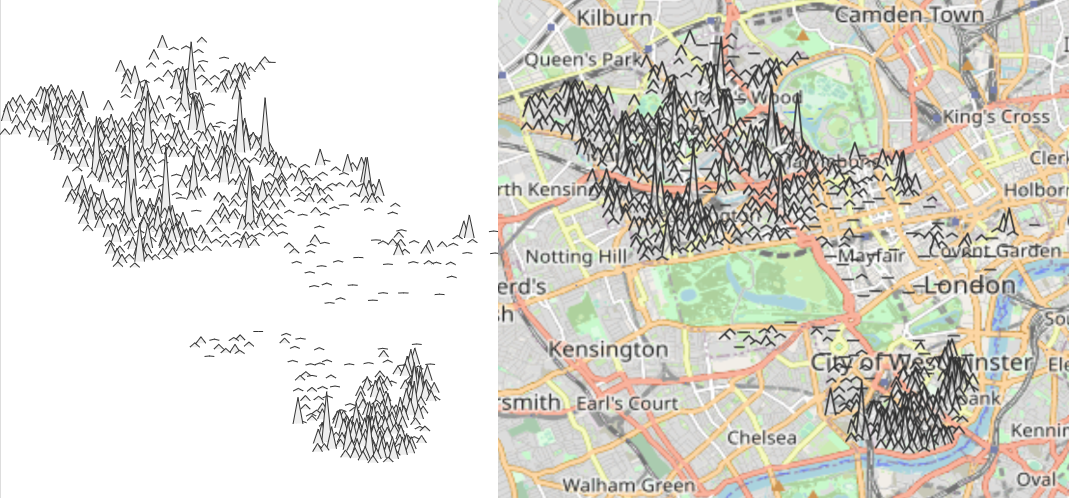
After lots of trouble with other vis (we will see), i thought it would be nice to have something like james cheshire's famous population lines
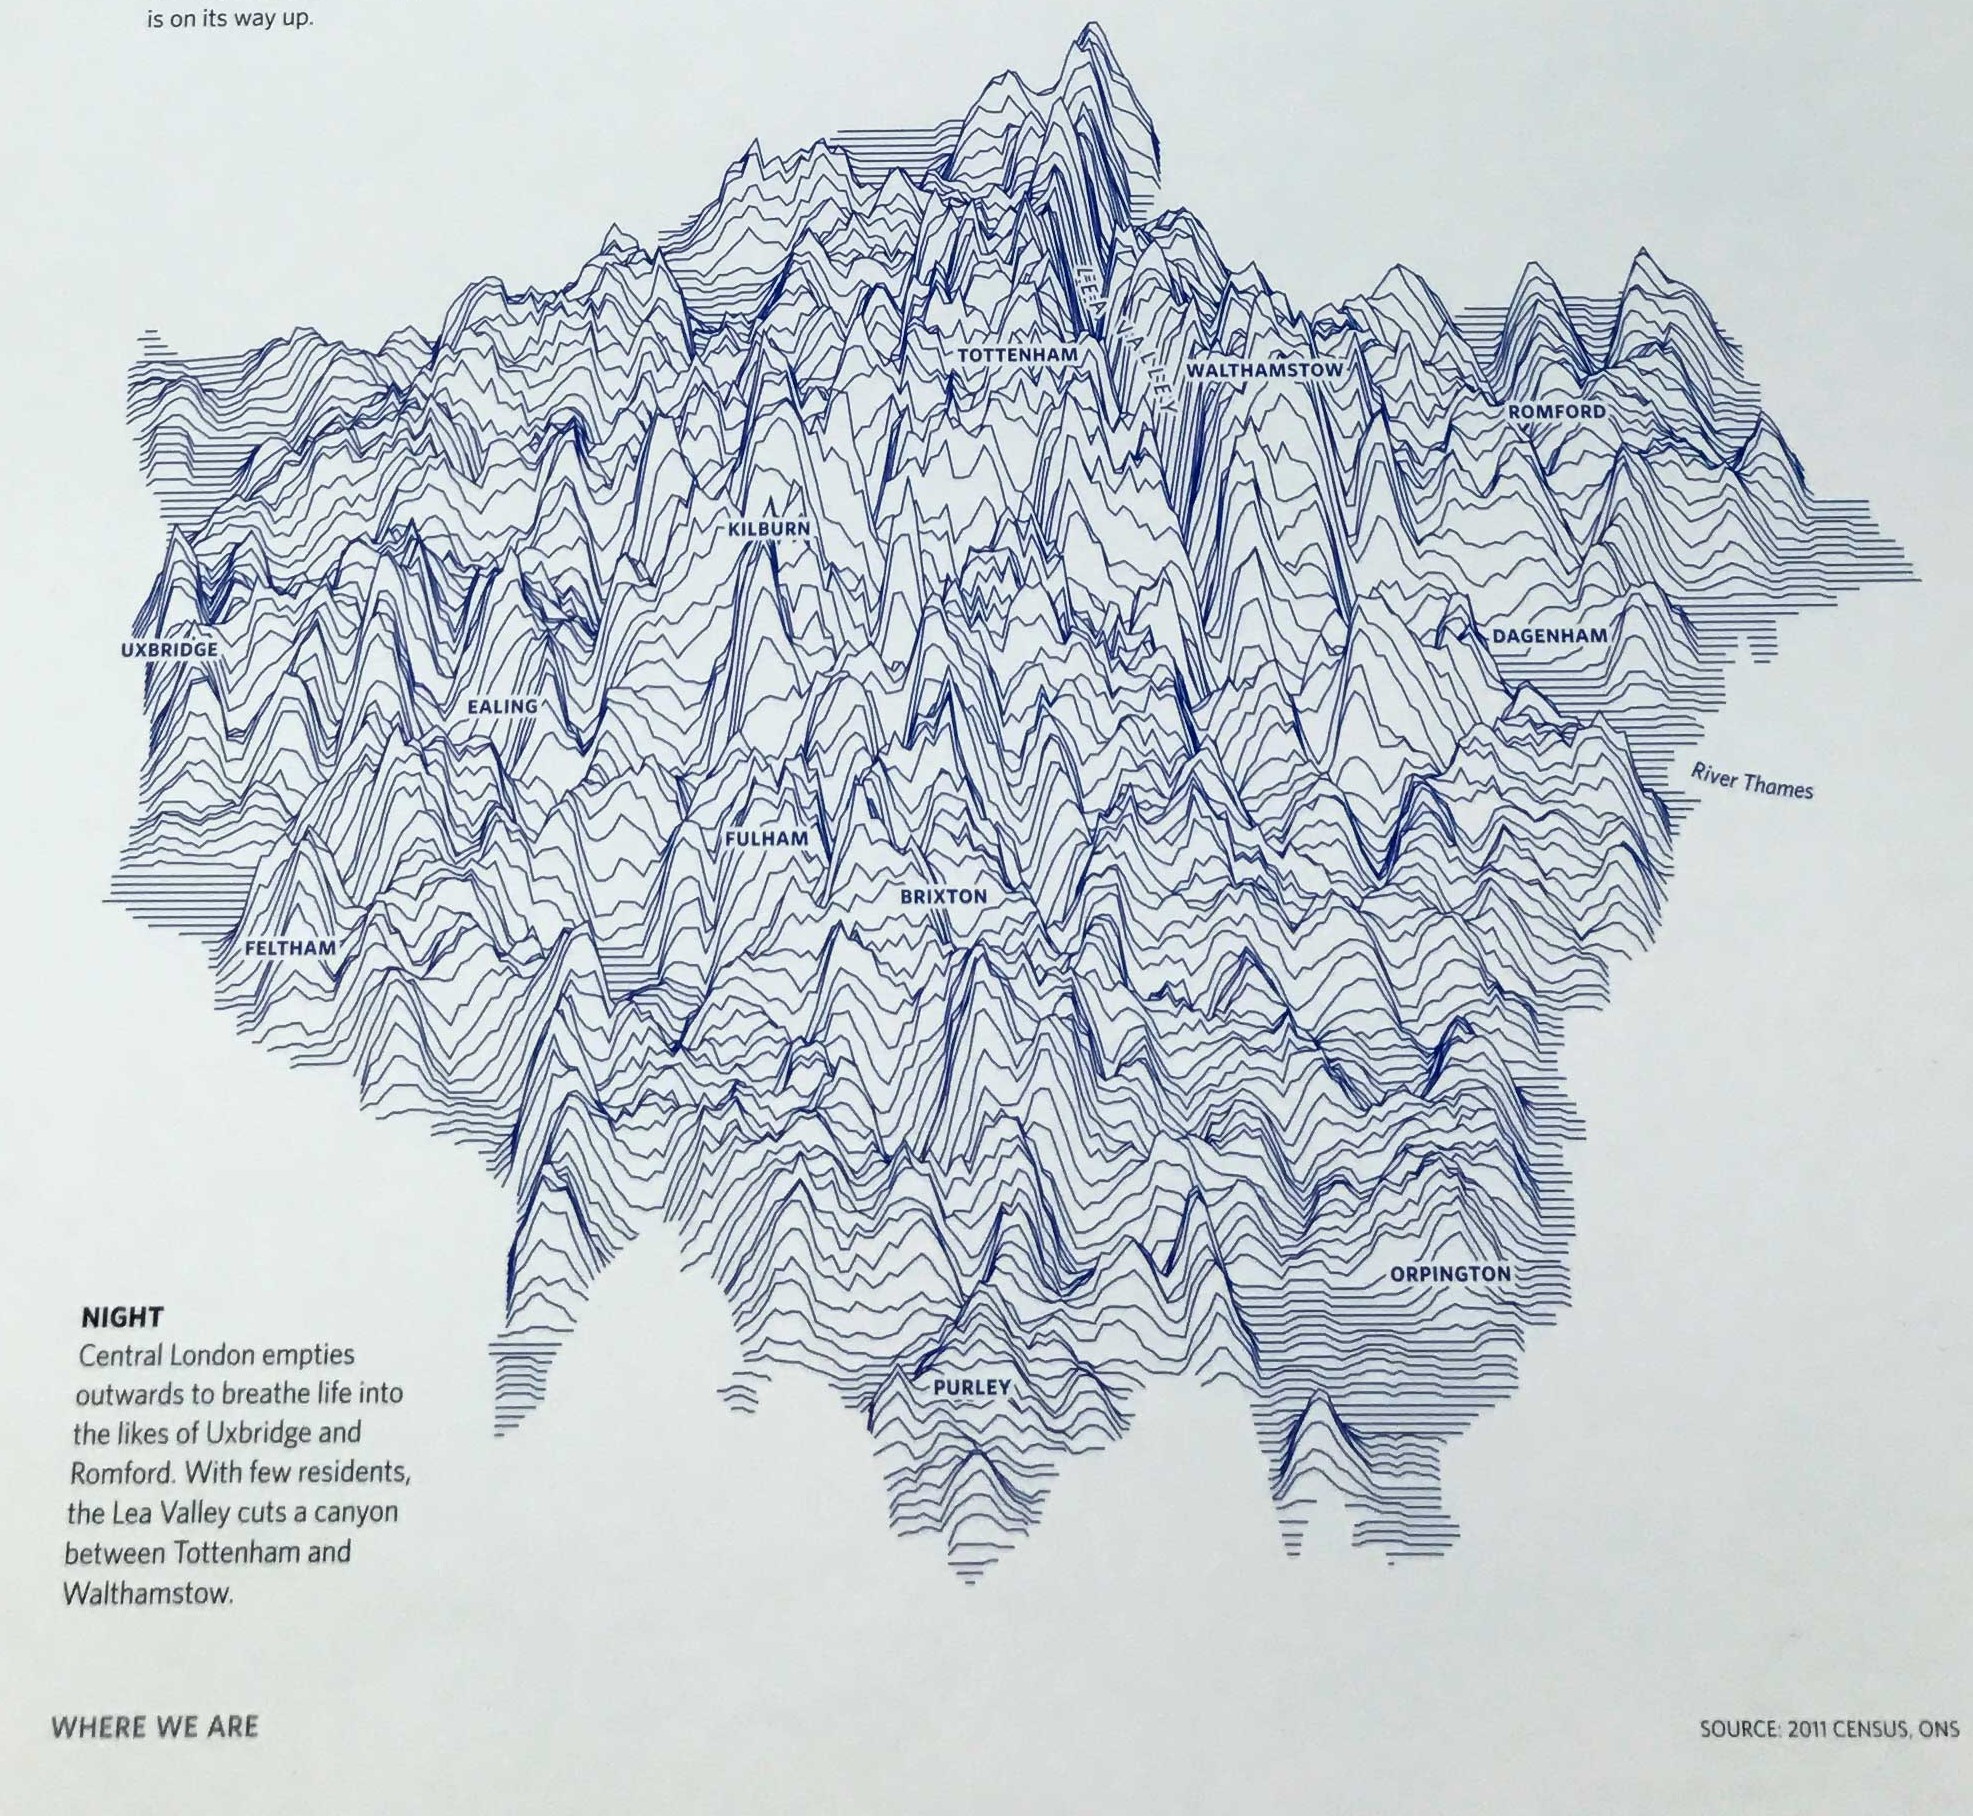
https://jcheshire.com/featured-maps/population-lines-how-and-why-i-created-it/
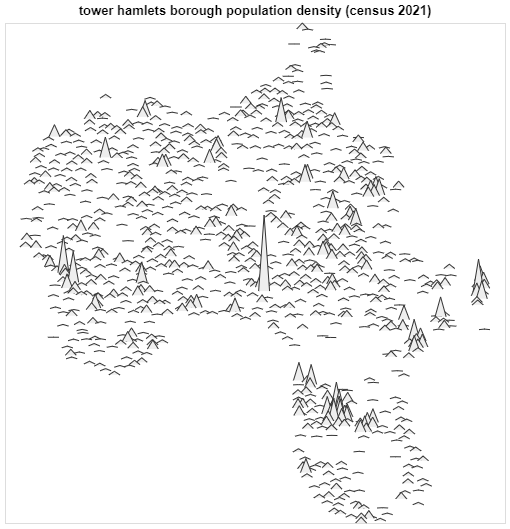
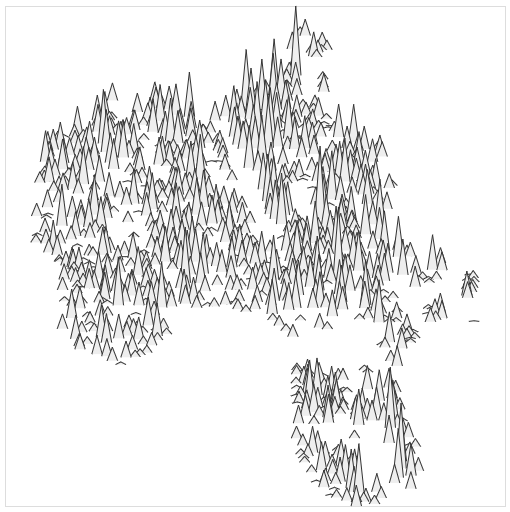
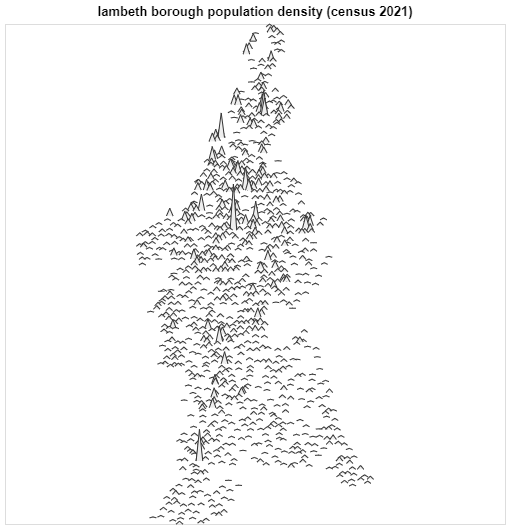
...then ended up with something like this:

before we start, a quick note about census geographies
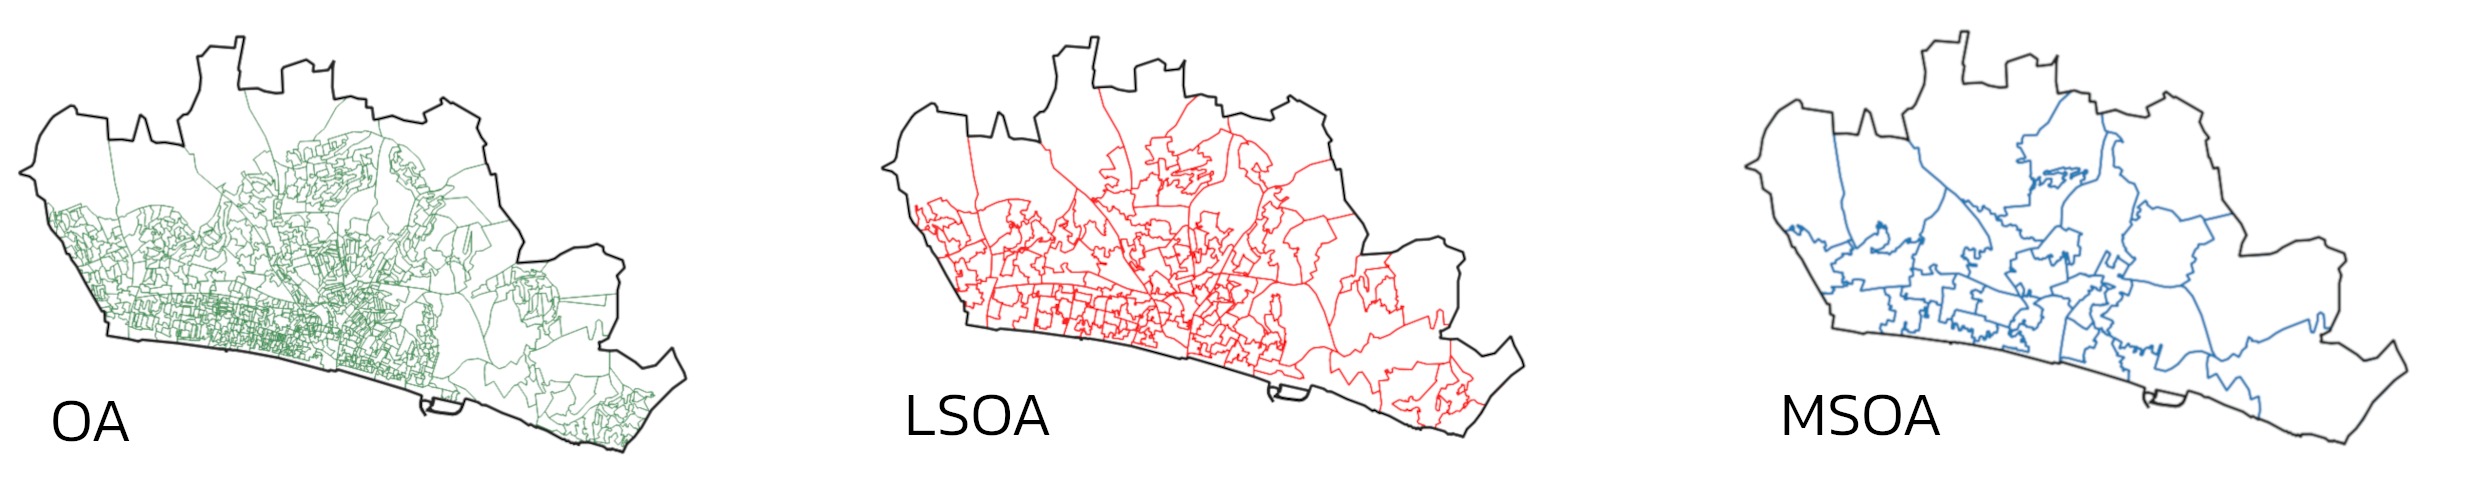
| OA | LSOA | MSOA | |
|---|---|---|---|
| 100-625 | 1,000-3,000 | 5,000-15,000 | people |
| 40-250 | 400-1,200 | 2,000-6,000 | households |
brighton example: https://ocsi.uk/2019/03/18/lsoas-leps-and-lookups-a-beginners-guide-to-statistical-geographies/
...ok let's go! census 2021 data for england and wales is out now
- I work for the part of London that is the "fastest growing, densest, least old, youngest local authority in the whole of the country": Tower Hamlets
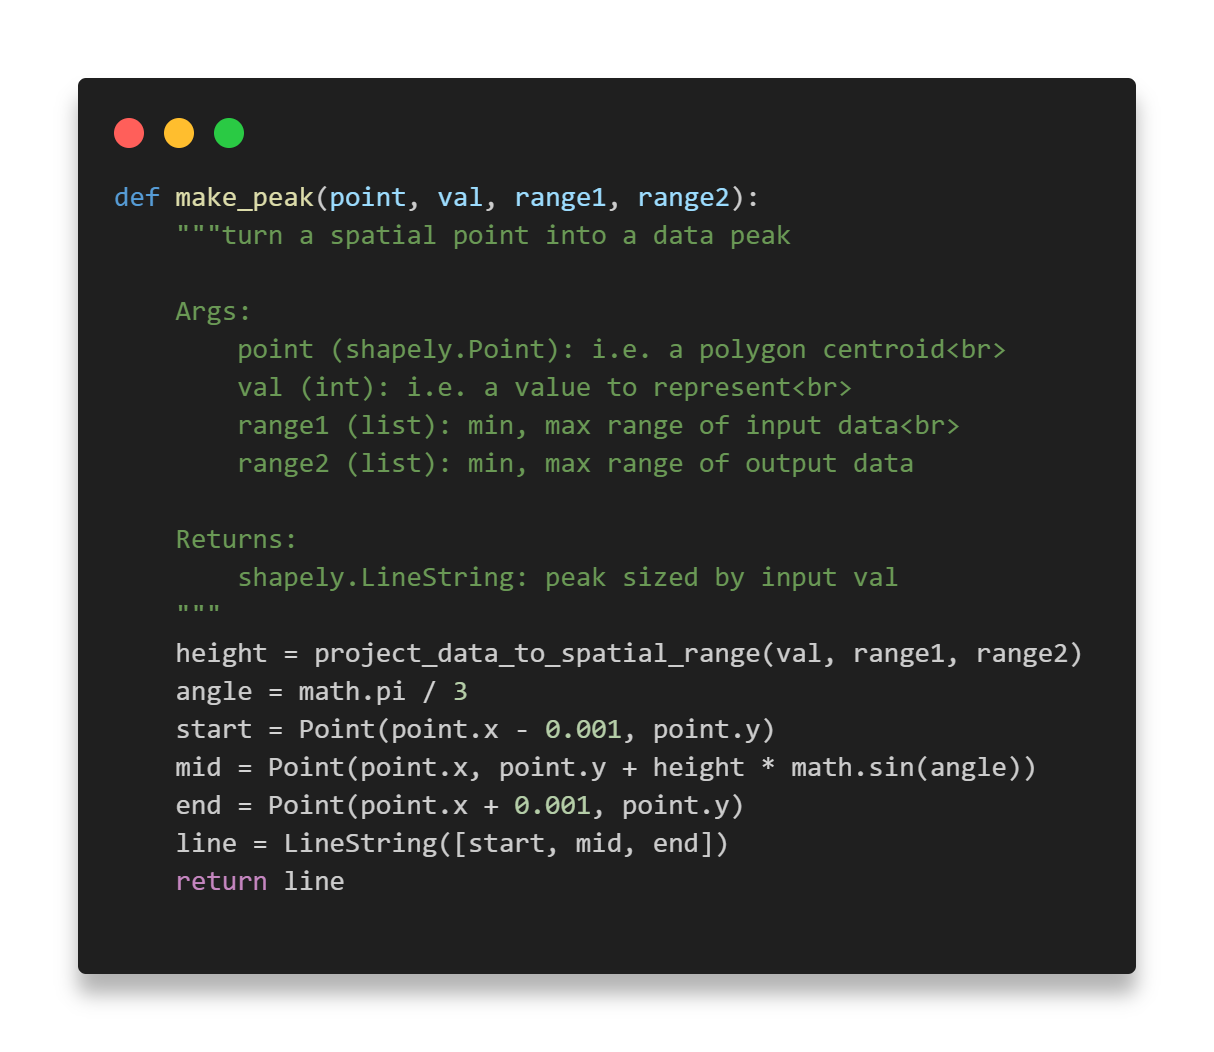
- in the course of trying to map some of these phenomena i ended up publishing a data vis package in python called data mountains
where is tower hamlets?
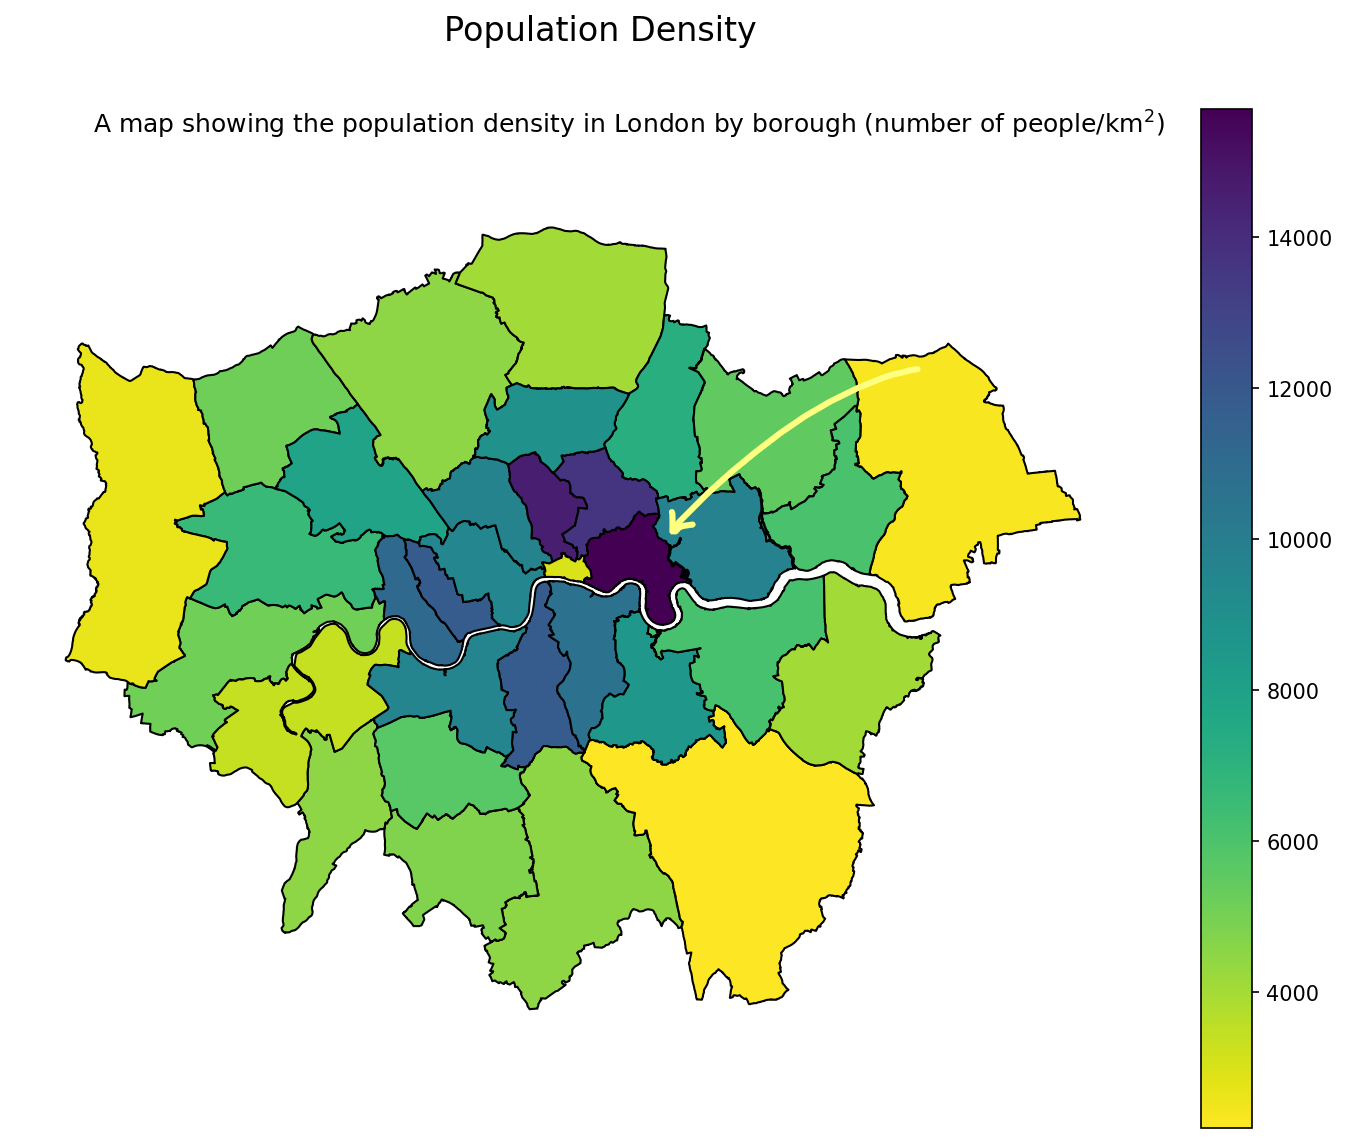
in 2011 islington was the most population dense borough
in 2021 the most population dense borough is tower hamlets
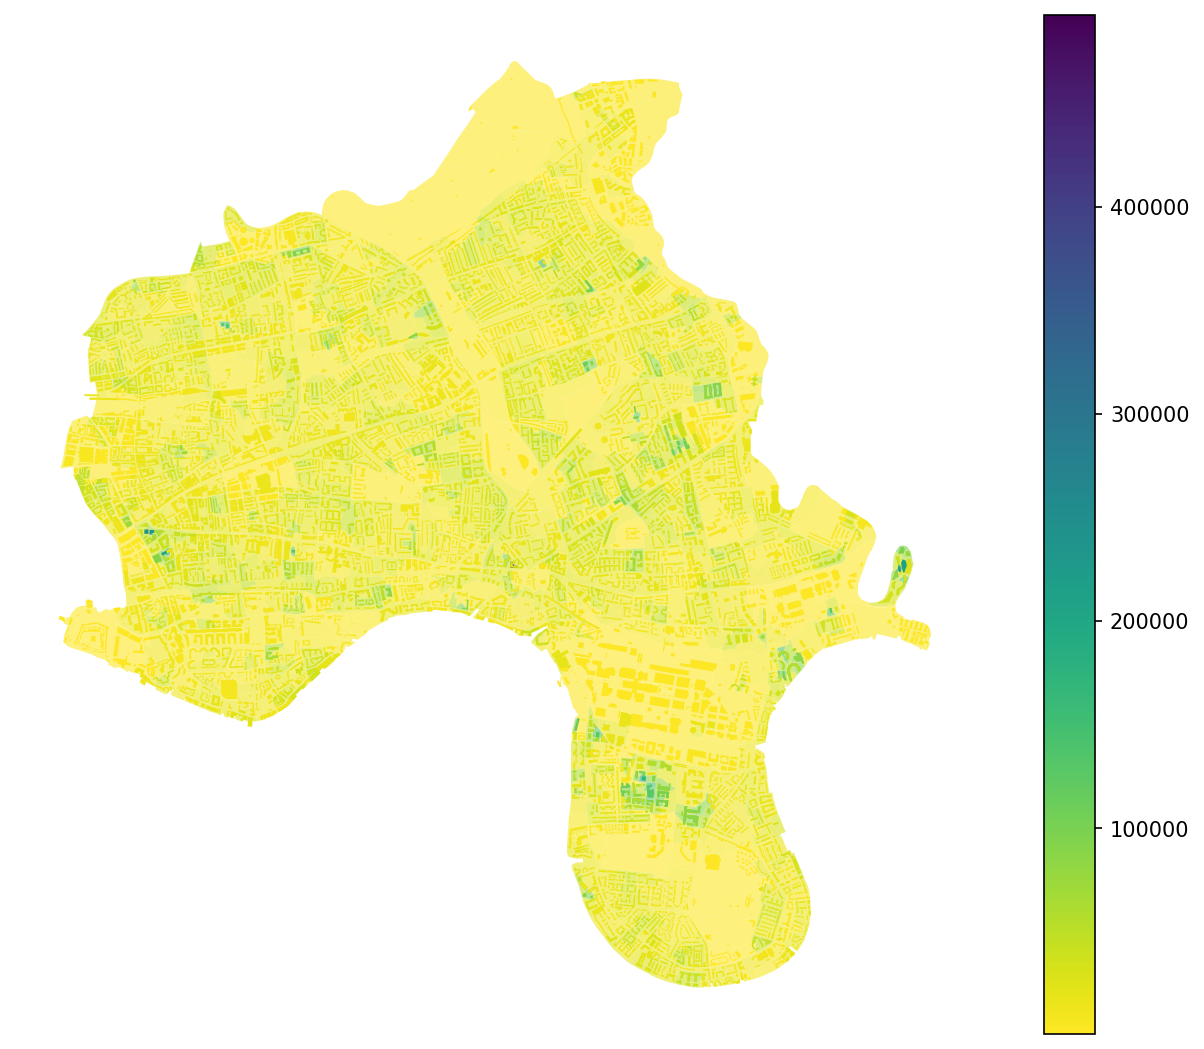
...hmm, the data is not normally distributed

a few of the OAs, despite OAs having roughly the same number of people (about 300), have really high population density
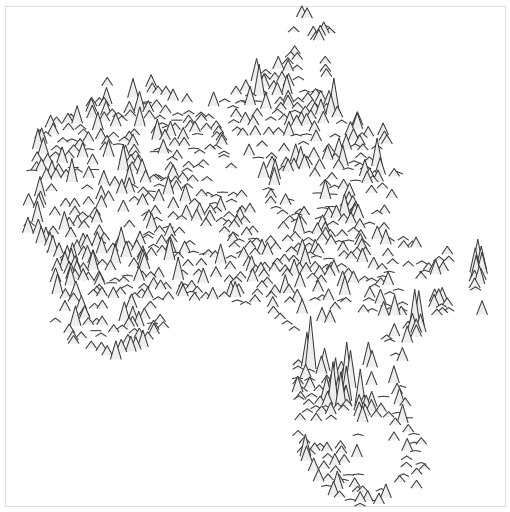
so we log transform the data
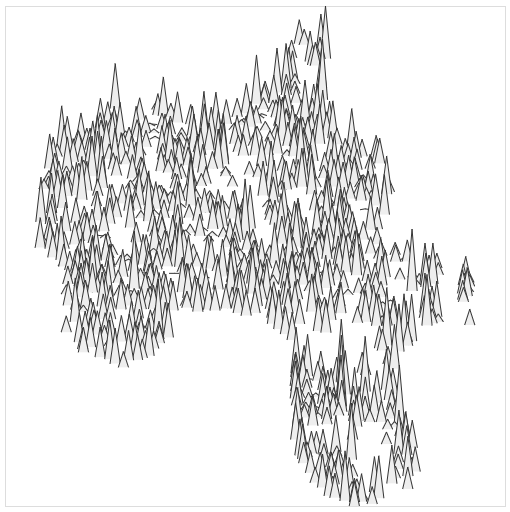
...but still we can't see those really high value polygons, they are still too small
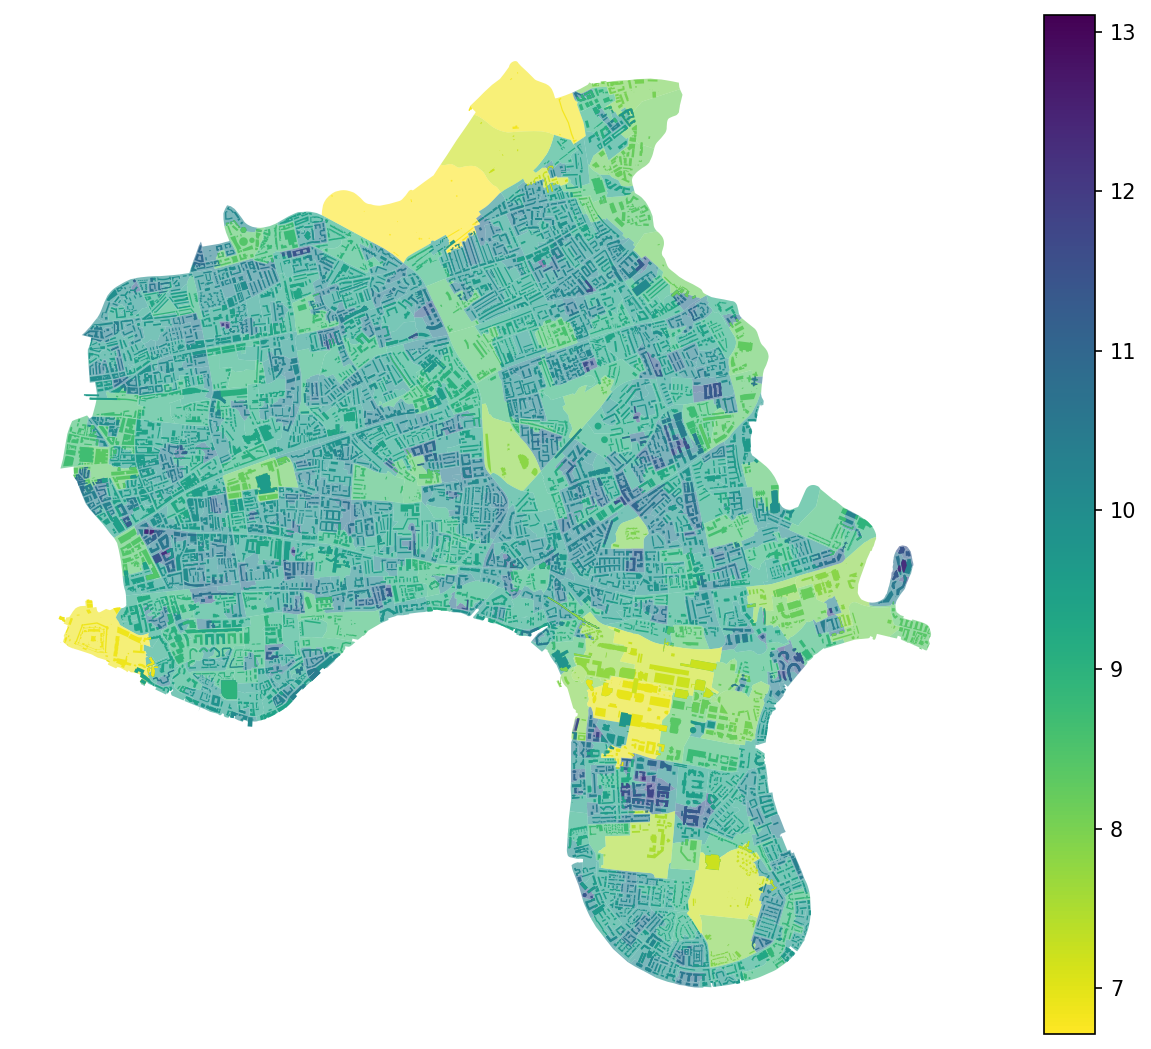
...and the legend is less useful now.
building footprints via https://osmnx.readthedocs.io/en/stable/internals-reference.html#osmnx-features-module
let's try a density equalising cartogram
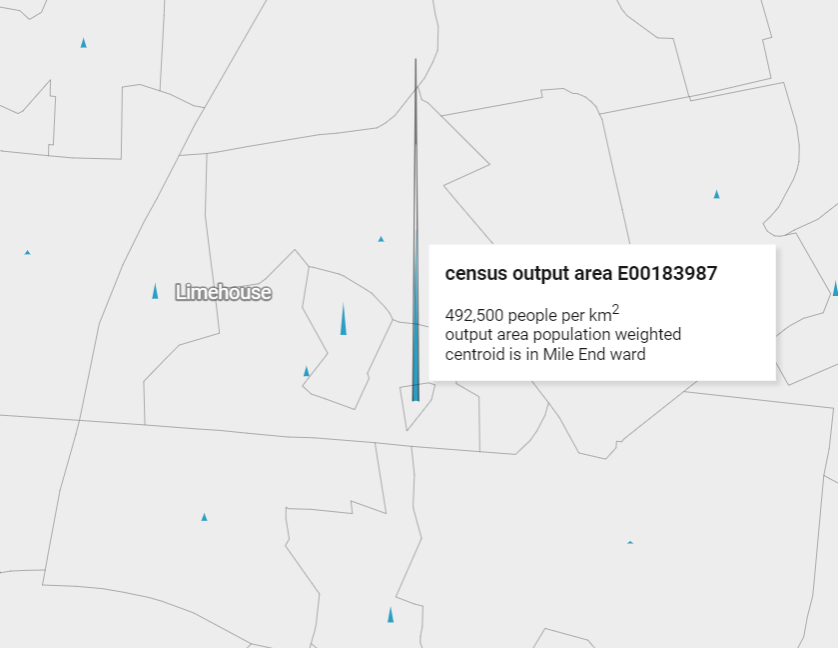
...aha, look right in the centre, there's something going on in Limehouse!
https://cran.r-project.org/web/packages/cartogram/readme/README.html
...remember this?
...ah yes, that is a very small census area, so the density is high relative to the space
https://www.datawrapper.de/_/VPYgl/
this is what's known to the ONS as a "corner case" - some corners (or holes) in the 2011 OAs have been cut to fit OAs to size thresholds in 2021 - so sometimes they end up with just one building for example...
here it is, a statistical geography that is just a slice of one building: Coral Apartments in Limehouse
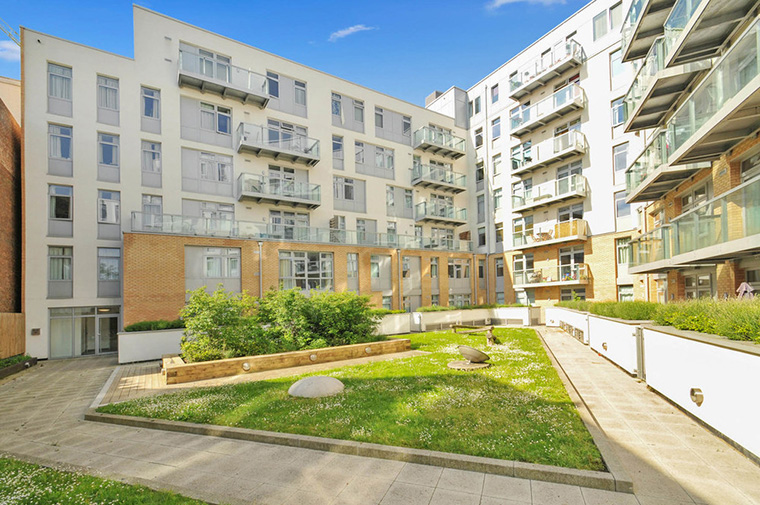
...the OA dataset has a few outliers - the pointed datavis was a good way to make this salient (instead of choropleth or cartogram)
here is the coral apartments OA over last two censuses
population density
let's try another dataset: one bedroom homes
two bedroom homes
the limitations of the technique become apparent when the mountains obscure each other, the solution is to use rotation!
https://github.com/cydalytics/HK_Properties_Price_Distribution
three bedroom homes
four or more bedroom homes
population density again, it can a bit odd at OA resolution
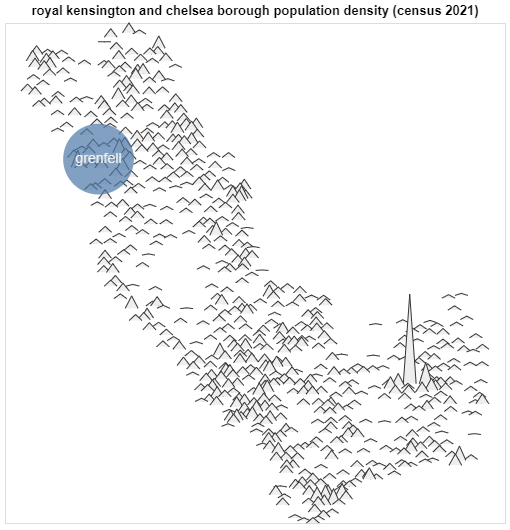
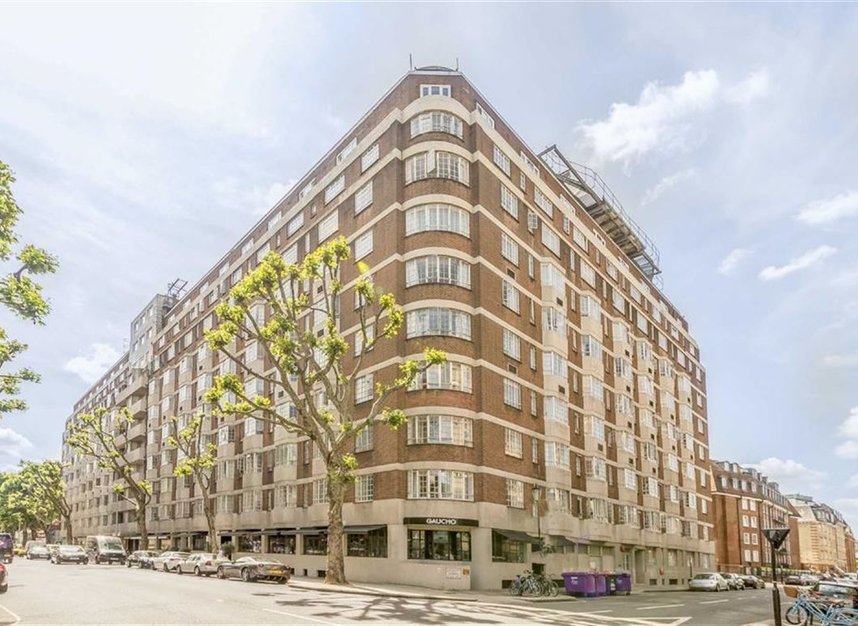
the OA intersecting chelsea cloisters has a population density of 2,000,000 pop/km^2 (the highest in the country as it turns out).
apperently the LSOA population density holds remains plausible throughout (the densest LSOA is in Croydon: 116,000 pop/km^2), but there are a few "corner case" outliers in the OA dataset, this being the most extreme.
https://www.ons.gov.uk/visualisations/censuspopulationchange/E09000020/
... also see https://www.ons.gov.uk/visualisations/dvc1371/#/E09000020
here is the super dense chelsea cloisters OA over last two censuses
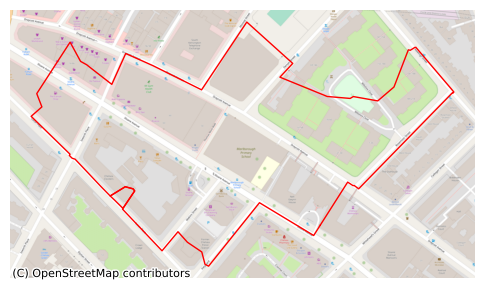
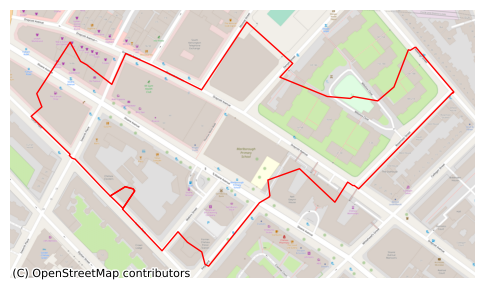
...it didn't change; though the neighbour did
data mountains in greenwich
population density
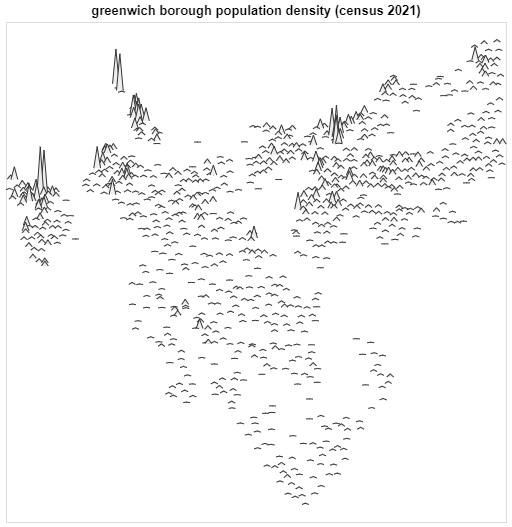
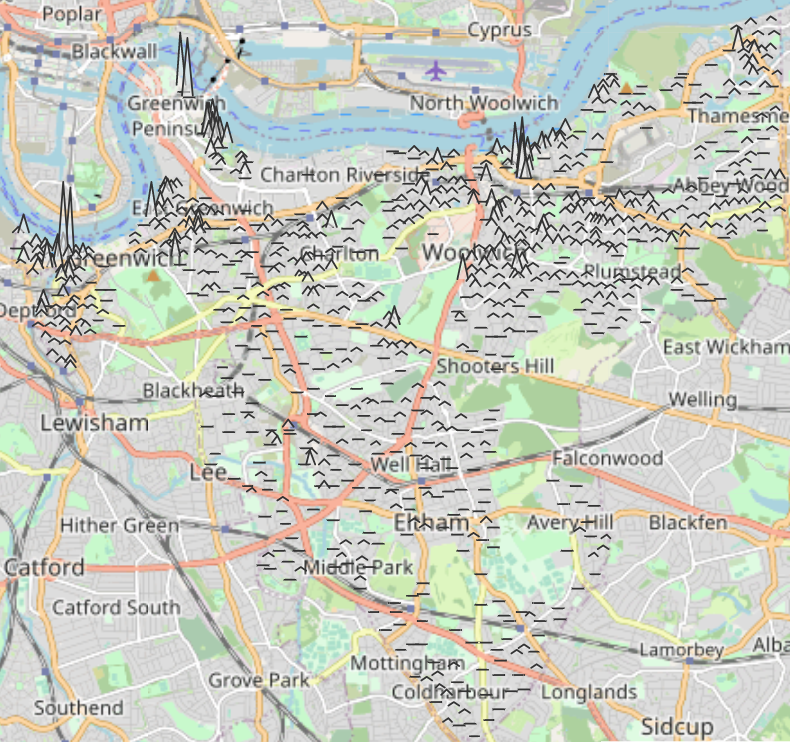
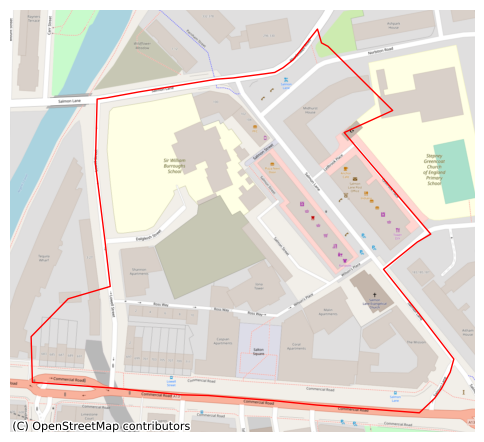
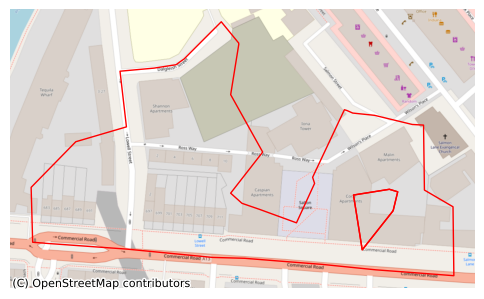
there's a nice primordial forest here that was almost concreted over in 1994 - you can still make out what would have been a motorway route along the less populated eastern hills and marshes, although the transport minister did compulsorily purchase many homes too https://www.roads.org.uk/ringways/ringway2 (cheers openstreetmap contributors)
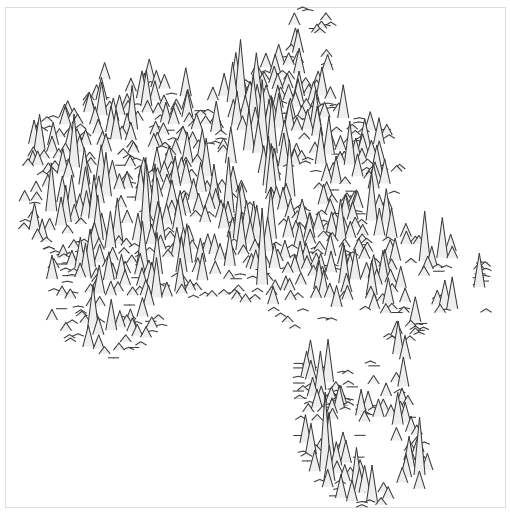
data mountains in southwark
population density
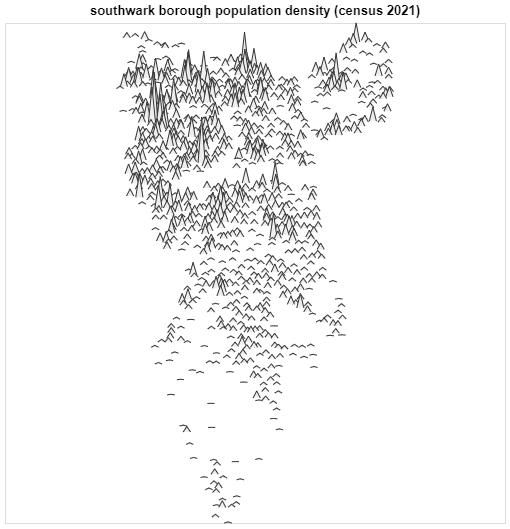
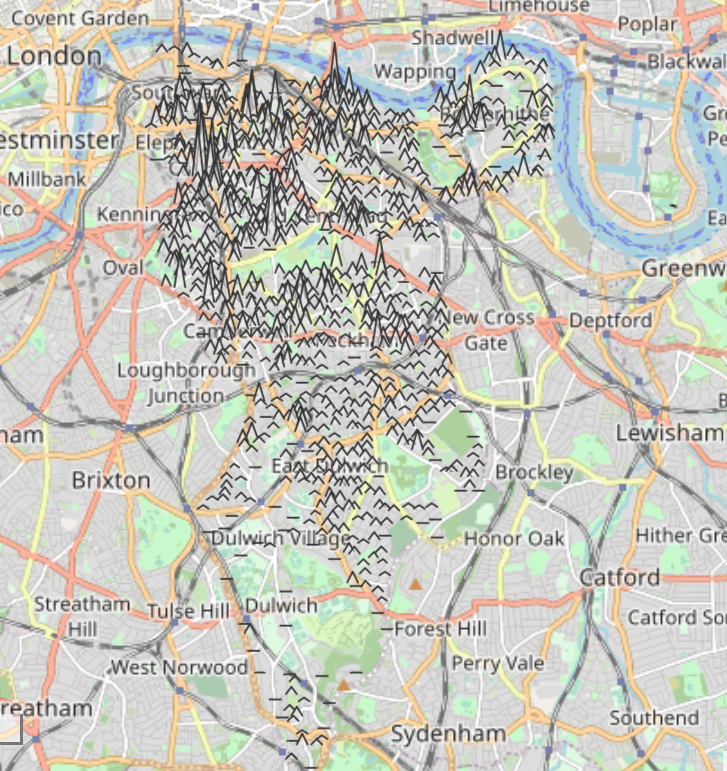
data mountains of southwark. i really like this one as it shows the graduation of people from the riverside metropolis south toward the last vestiges of the great north wood. (cheers openstreetmap contributors)
in summary
- good at showing outliers in exploring data
- may lend itself to data storytelling
- rotation is needed